
From restoring threatened ecosystems to improving agricultural productivity, many of the decisions shaping Australia’s landscapes begin with a single question: what is the data telling us?
Geographic Information Systems (GIS) are helping answer that question by transforming complex environmental information into visual stories, giving landholders, researchers and decision-makers a clearer understanding of the landscapes they manage.
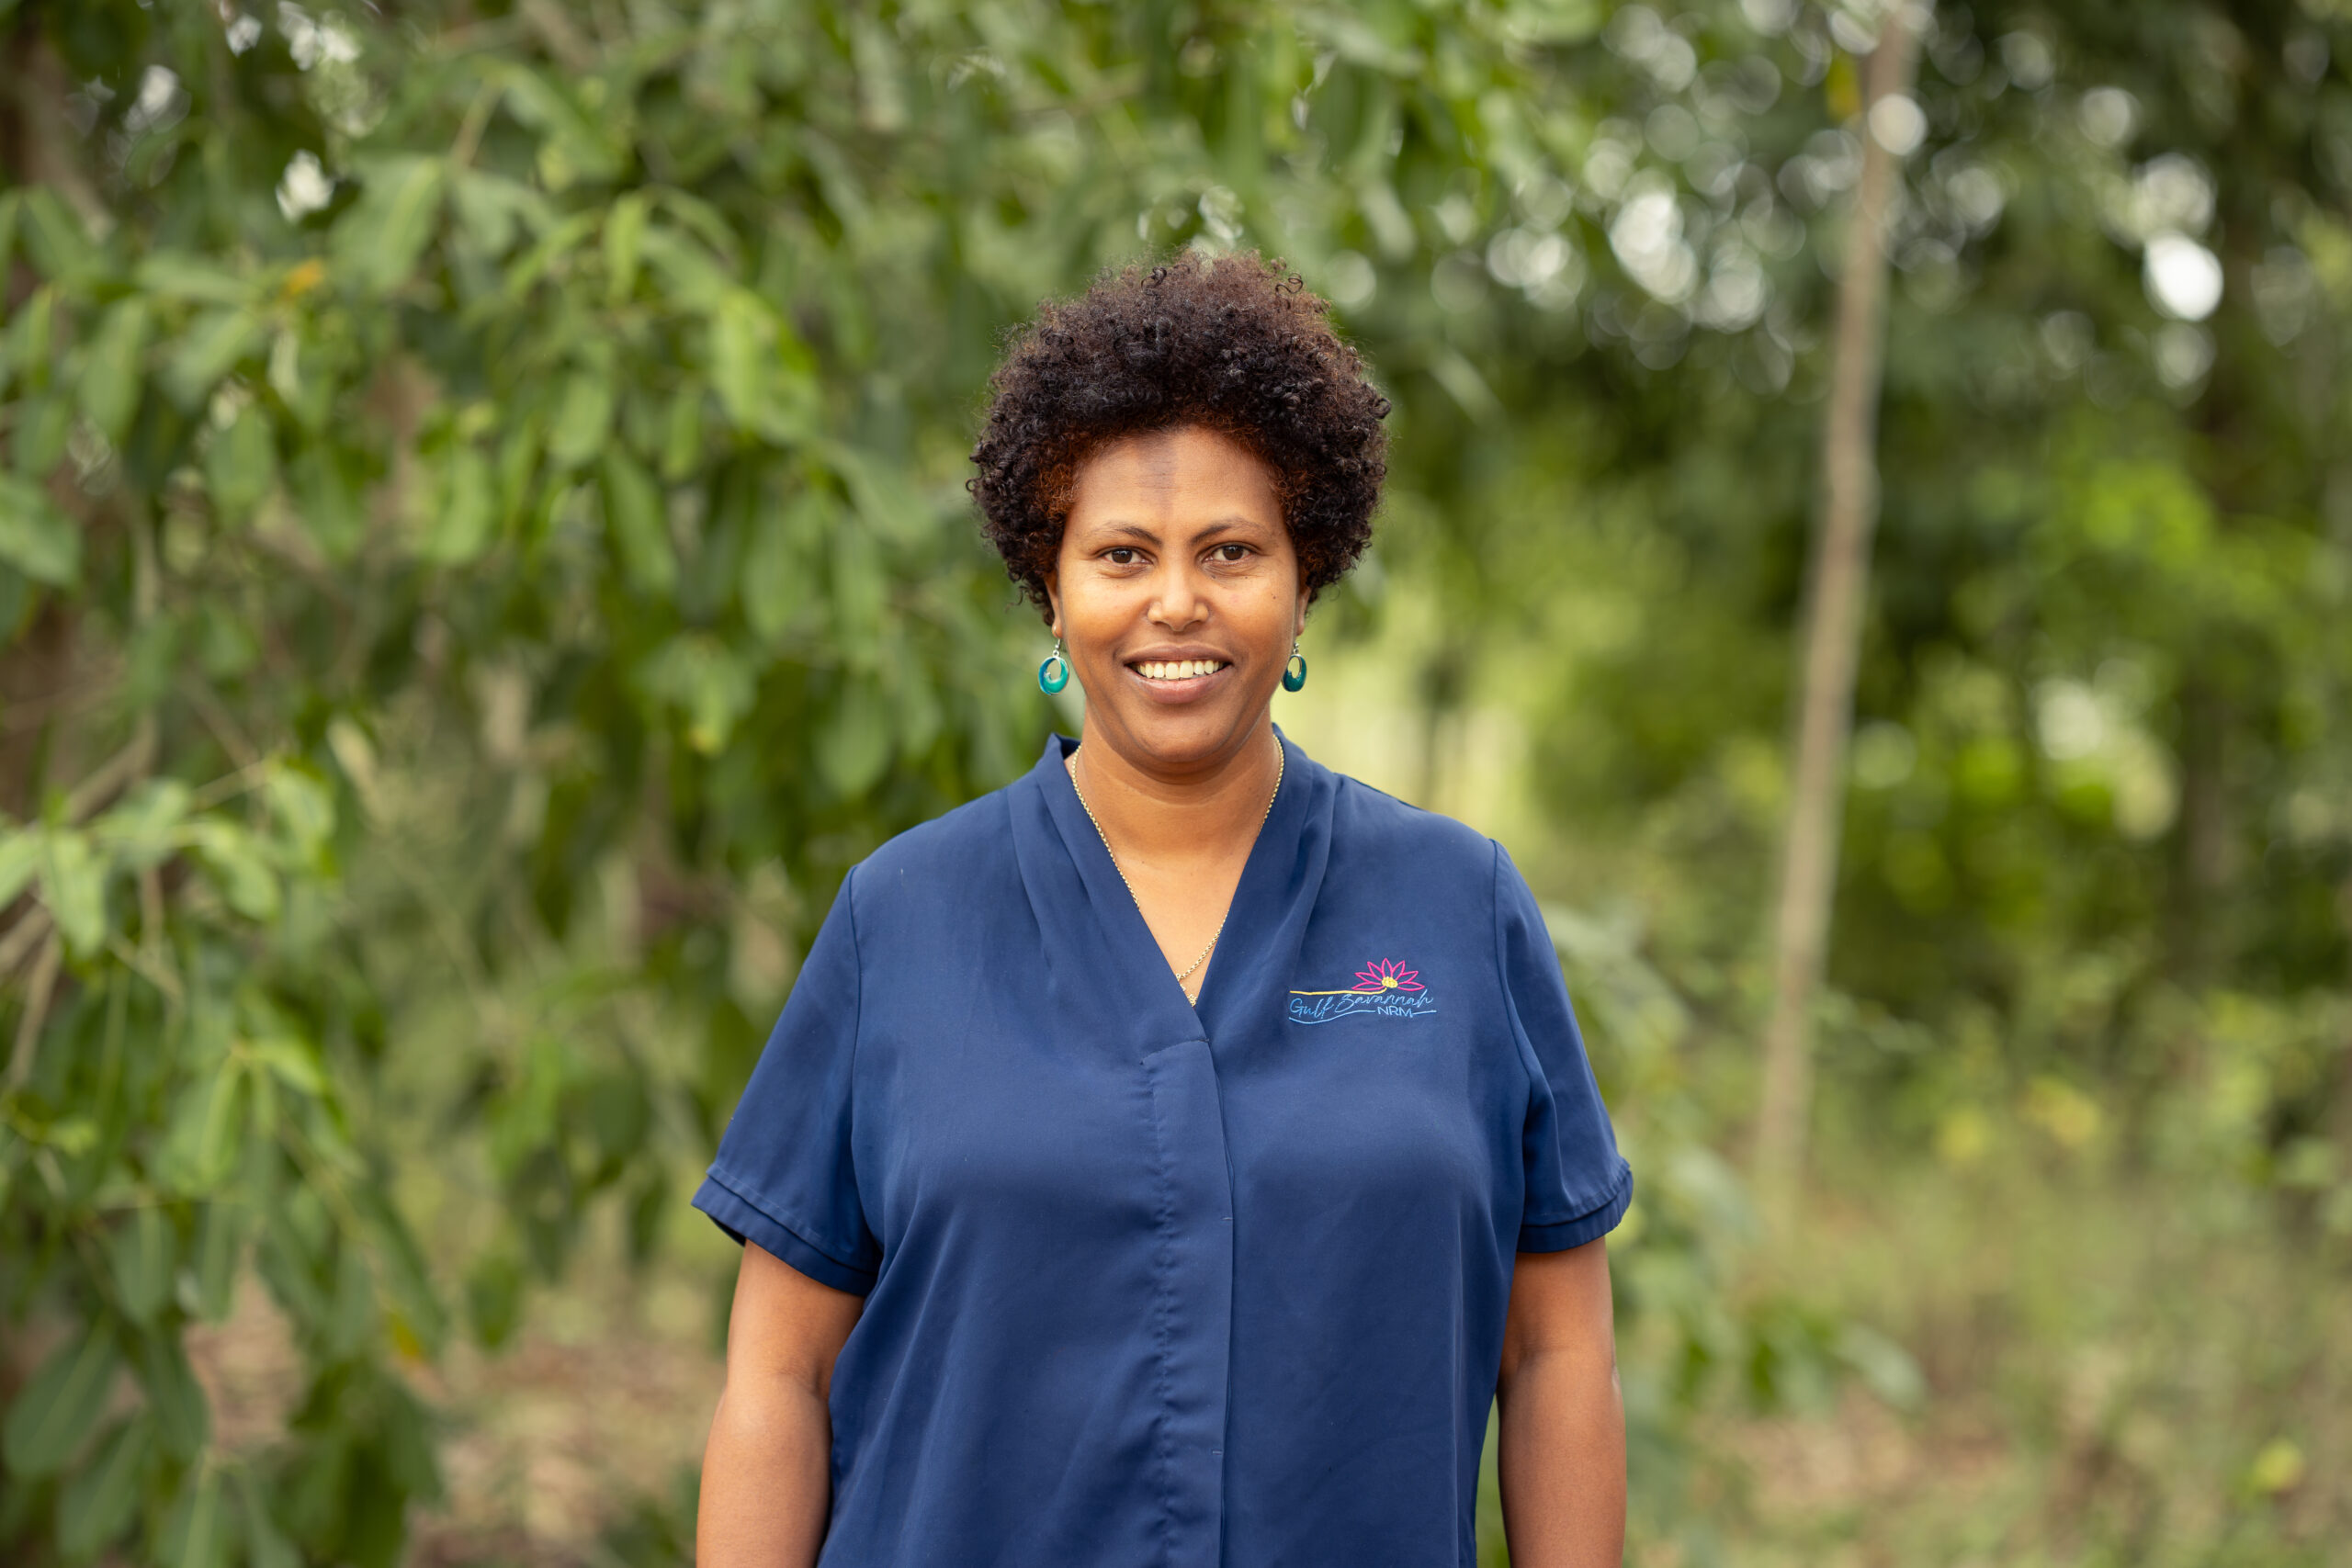
Gulf Savannah NRM GIS Officer Dr Mahtsente Tadese knows this well.
With an initial background in agricultural engineering, Dr Tadese first discovered the value of GIS while completing a master’s degree in water resource management, where she researched irrigation and water-use efficiency. She later expanded that knowledge through a PhD investigating how climate change projections and land-use impacts could influence the future of her home country, Ethiopia.
Her research may have evolved from water management to climate change, but the approach remained the same: using spatial data to better understand landscapes and turn figures into powerful images.
“GIS is a tool you use across a wide range of studies and research,” Dr Tadese said. “In some disciplines, it is almost impossible to carry out research without GIS”
She emphasises that GIS is much more than digital mapping: it captures, manages, analyses and displays information linked to locations, representing multiple layers of data, from vegetation and waterways to soils, infrastructure and land use.
And instead of presenting pages of numbers, GIS allows those answers to be visualised in ways that are easier for the public to interpret.
“Rather than words and numbers, GIS visually expresses ideas,” Dr Tadese said. “It makes data more accessible and understandable, allowing for better communication of knowledge and information.”
This alternate way of communicating is perhaps Dr Tadese’s favourite aspect of working with GIS.
“It’s more engaging – you can use different colours, shapes and sizes to catch audiences and emphasise key information,” she said. “Especially for those of us who are visual learners, GIS conveys so much more than a spreadsheet ever could.”
That ability to turn data into accessible information has made GIS an increasingly valuable tool across almost all industries, including natural resource management.
In conservation, spatial analysis helps identify biodiversity hotspots, map wildlife habitat and monitor environmental change over time, supporting efforts to protect vulnerable ecosystems.
In agriculture, it combines information about soils, water, climate and land capability, helping producers make more informed decisions about productivity and sustainable land management.
In practical terms, it helps to propose and answer specific questions, such as: where are invasive weeds spreading? Which areas provide critical habitat for threatened species? How is drought affecting a catchment? And where should restoration efforts be prioritised?
Importantly, its role doesn’t end once a project begins, nor is it only called upon when the work wraps up.
“You can use GIS at every stage of a project, from conception to implementation, and for tracking progress throughout,” Dr Tadese said.
At Gulf Savannah NRM, that might mean producing property infrastructure and risk assessment maps to help landholders strengthen drought and climate resilience, or it can involve digitising weed distribution data to support coordinated weed management throughout the region. Regardless of the specifics, every project and officer across the organisation requires Dr Tadese’s expertise.
With global food production expected to increase by almost 50 per cent by 2050, peak bodies such as the United Nations Food and Agriculture Organisation say geospatial data will play a critical role in helping agriculture respond to climate change, biodiversity loss and other environmental pressures.
By turning data into something people can see and act on, GIS is helping ensure that decisions about the future of our landscapes are grounded not only in science, but in a vivid understanding of the places we live, work and care for.
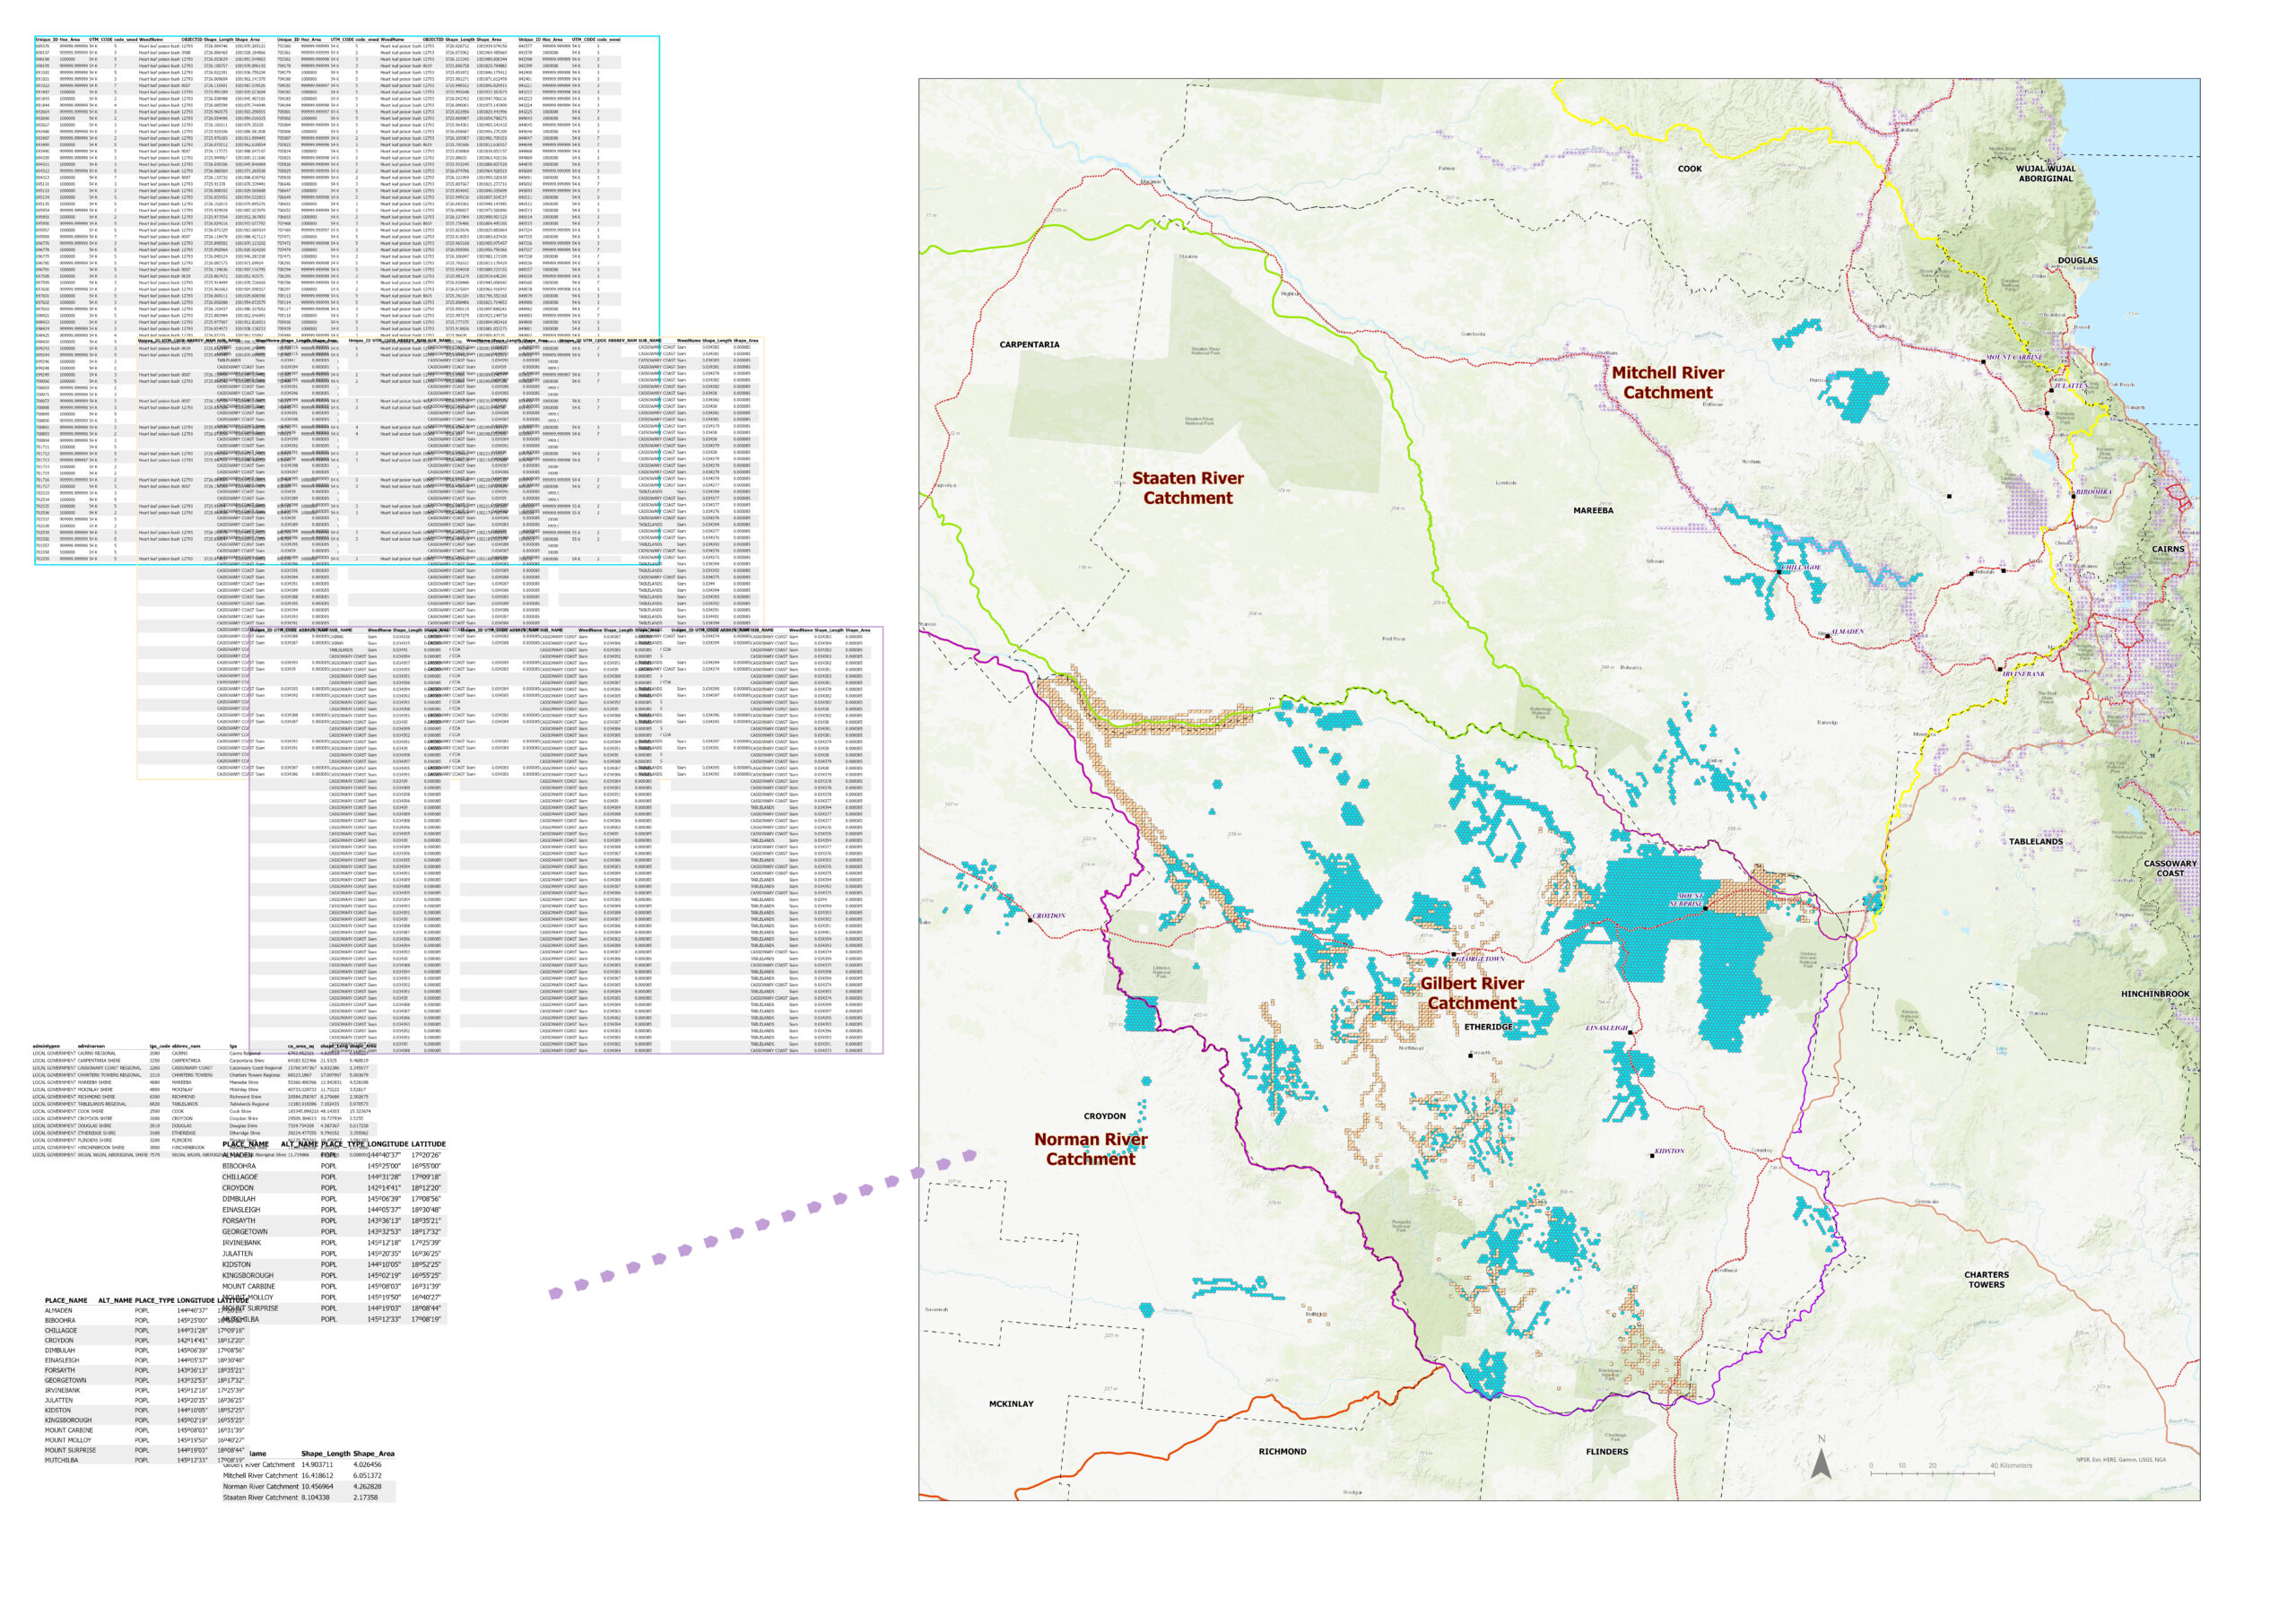
PHOTO: GIS-based weed distribution mapping using spatial analysis and digitising. This graphic shows how data translates into a visual story for landholders and decision-makers to better understand.